

Are hidden speed bumps killing your conversion rates?
The foundational research everyone references comes from Google's 2016 study analyzing the relationship between mobile page load times and bounce rates. This landmark research found that as page load time increases from 1 second to 3 seconds, the probability of a mobile user bouncing increases by 32%. When load time extends to 5 seconds, bounce probability jumps to 90%. The study examined data from over 900,000 mobile ad landing pages and established the now-famous correlation between speed and user behavior that became the industry standard for understanding performance impact.
However, this foundational study tells only part of the story. While Google's research established that speed matters, it didn't account for the performance impact of the very tools we use to optimize our sites. The study measured natural loading conditions, not the real-world scenario where A/B testing tools add their own performance overhead to pages that users actually experience.
The unfortunate truth: while you're running A/B tests to boost conversions, your testing tool might be sabotaging the whole effort. Most e-commerce brands have optimized everything from their email campaigns to their ad targeting, yet they're unknowingly using testing tools that slow down their sites the moment visitors arrive.
You deserve testing tools that enhance your performance, not compromise it.
This isn't an isolated incident. Research across academic studies, industry reports, and platform-specific analysis reveals that most A/B testing tools routinely add 100-1500ms to page load times and degrade Core Web Vitals scores by 10-30%.¹⁻³ Individual testing tools have been measured contributing up to 600ms average response time to page loads,⁴ while real user monitoring studies document over 30% improvement in First Contentful Paint when testing tools are disabled.⁵ The evidence shows these tools frequently reduce the conversion rates they're designed to improve.
The Google Data Point: Why Page Speed Really Matters
The One Study Everyone Quotes
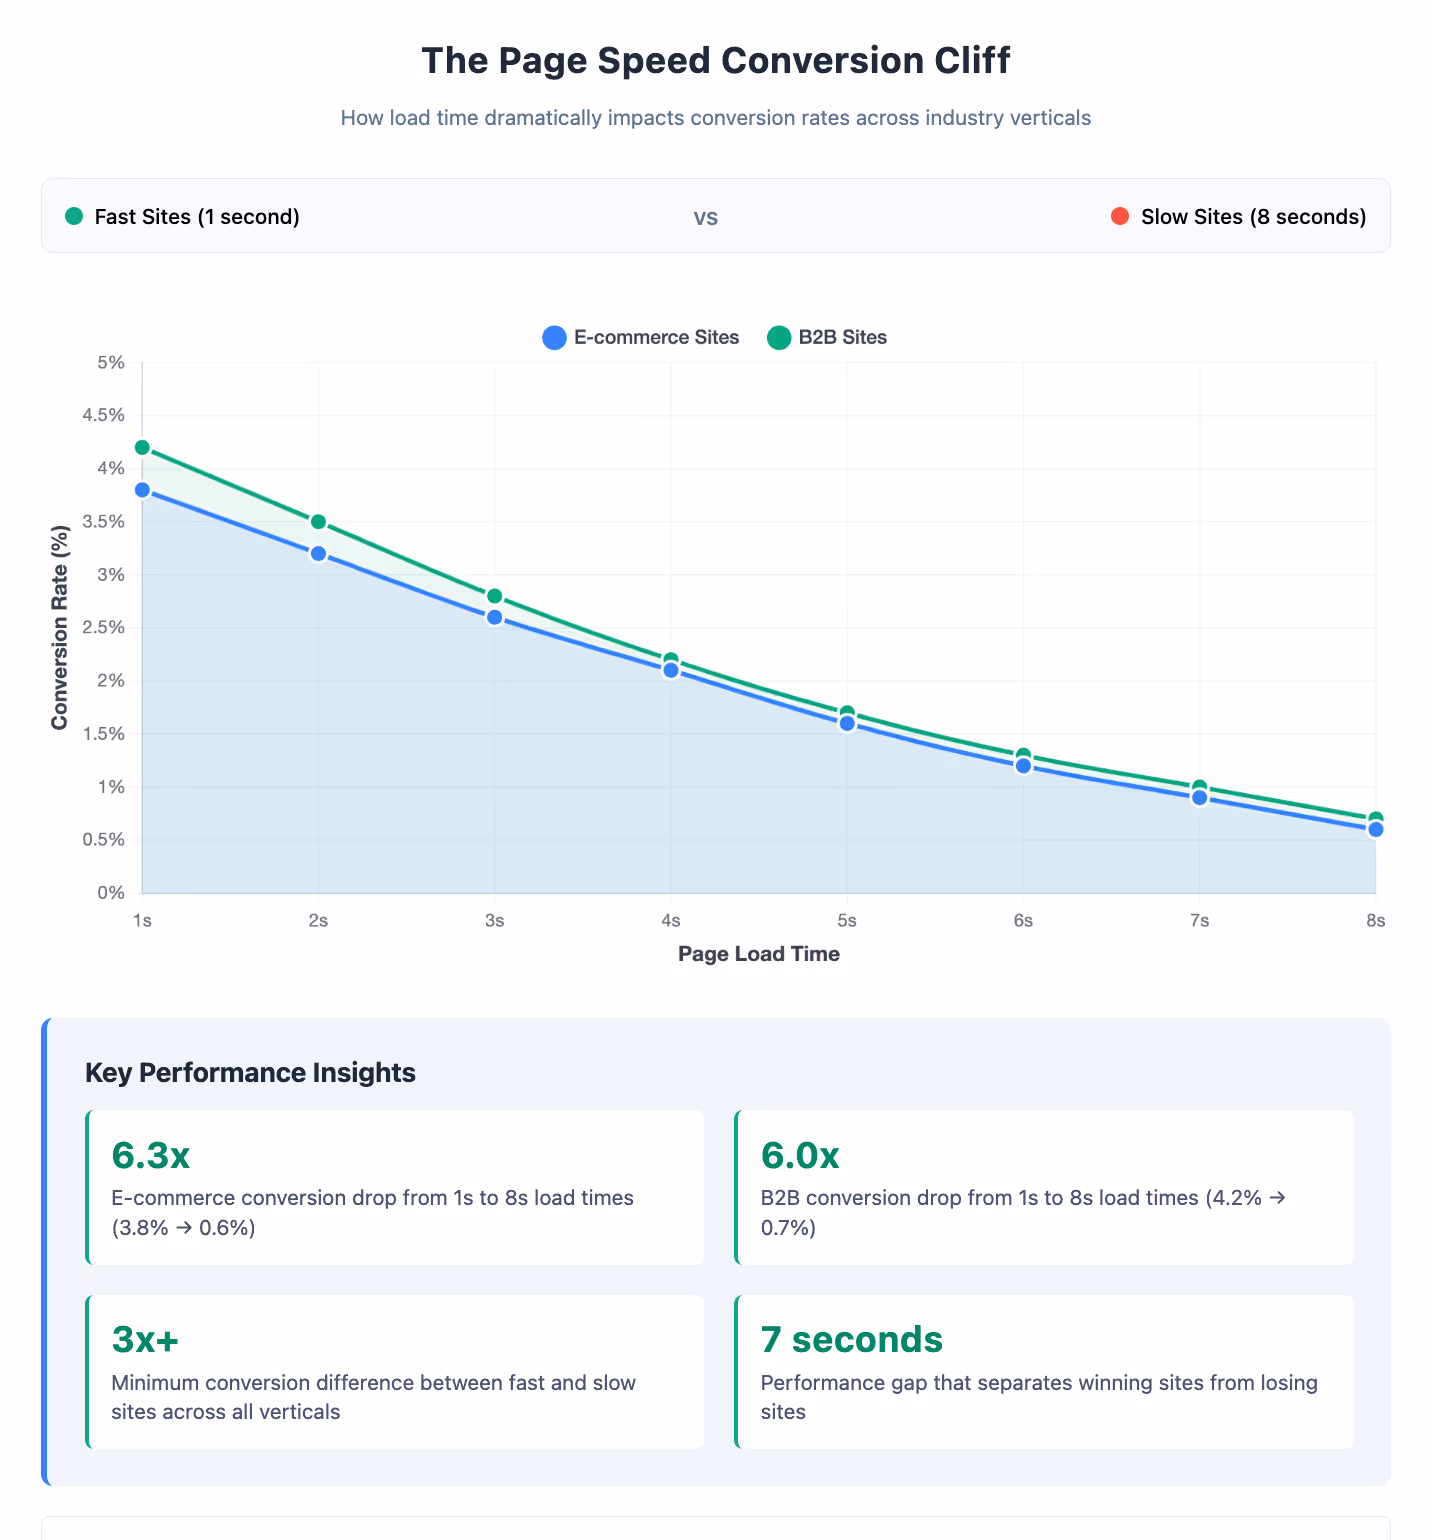
Google's half-second correlation study has become the industry's go-to statistic. While it established the foundational importance of speed, recent comprehensive studies provide more nuanced data. E-commerce sites show 2.5x conversion improvements when page load times are optimized,⁷ while B2B sites loading in 1 second achieve 3x higher conversion rates than 5-second sites.⁸ These findings go far beyond the original Google research, showing consistent patterns across industries and use cases.
The Real Performance Impact on E-commerce
2023 performance benchmarking across 4+ billion web visits reveals the true stakes of the performance game with testing tool deployment, especially on mobile devices where sites lacking performance focus can run 70.9% slower than desktop,⁹ creating cascading impacts on user engagement. HTTP Archive data shows that as of September 2023, only 42.5% of websites pass all Core Web Vitals assessments,10 representing a critical performance gap that affects both user experience and business outcomes.
But the impact extends far beyond immediate conversions. Amazon's research shows 100ms latency increases reduce sales by 1%, potentially costing $1.6 billion annually.11 Walmart documented 1% incremental revenue increases for every 100ms improvement,12 while Vodafone's 2024 study showed 31% Largest Contentful Paint improvements led to 15% better lead-to-visit rates and 8% sales increases.13
The Post-Google Study Era
We've moved into a more nuanced era where the need to dive deeper into performance reviews with real-world conditions such as actual traffic loads, diverse devices, and varying network conditions cannot be overstated. Similarly, understanding the performance impact from third party tooling use, such as A/B testing implementations, must be considered to get a complete picture of customer experience.
The A/B Testing Performance Paradox
How A/B Testing Tools Can Kill What You Are Trying to Optimize
E-commerce teams are trying to improve conversion rates but unknowingly may be having the opposite impact. Industry research reveals that false positive rates can reach 26.4% in A/B testing,14 meaning more than one in four "winning" variations are actually false victories. Organizations implement these changes believing they'll boost conversions, only to see performance decline when rolled out site-wide.
The situation is compounded by the harsh reality that 80-90% of A/B tests fail to produce meaningful improvements,15 yet teams often attribute poor results to their hypotheses rather than questioning whether their testing tools are sabotaging performance. When your testing tool slows down your site by 200-300ms per visit, you're not just failing to optimize—you're systematically degrading the user experience while believing you're improving it.
The technical mechanisms behind this performance degradation are well-documented. Most A/B testing tools require server requests to determine which variation a visitor should see, creating a bottleneck where browsers must wait for network round-trips before displaying content—adding 100-300ms for DNS lookups and SSL handshakes alone, with additional delays based on geographic distance to testing servers.
Subscribe to the Shoplift newsletter
Get insights like these emailed to you bi-weekly!
{{hubspot-form}}
The Performance-First Testing Philosophy
The evidence is overwhelming: traditional A/B testing tools create a fundamental conflict between optimization and user experience. Performance-first testing resolves this conflict by treating speed as a prerequisite for conducting valid testing, not an acceptable casualty.
The core principle is simple: No optimization insight is worth sacrificing user experience. If your testing tool meaningfully slows down your site, any conversion gains you discover are built on a foundation of degraded performance that undermines long-term success.
Where Traditional Methods Fall Down
Most traditional A/B testing platforms work by layering code on top of existing sites. HTTP Archive data shows websites load 89% more third-party code than first-party code on average, with A/B testing tools contributing significantly to this bloat.
Typical Code Distribution:
- First-Party Code: ~450 KB
- Third-Party Code: ~850 KB (including A/B testing, analytics, ads, and other scripts)
Real-world performance testing reveals the true impact. Recent comparative analysis of different A/B testing approaches on the same e-commerce site showed dramatic differences in Core Web Vitals performance:
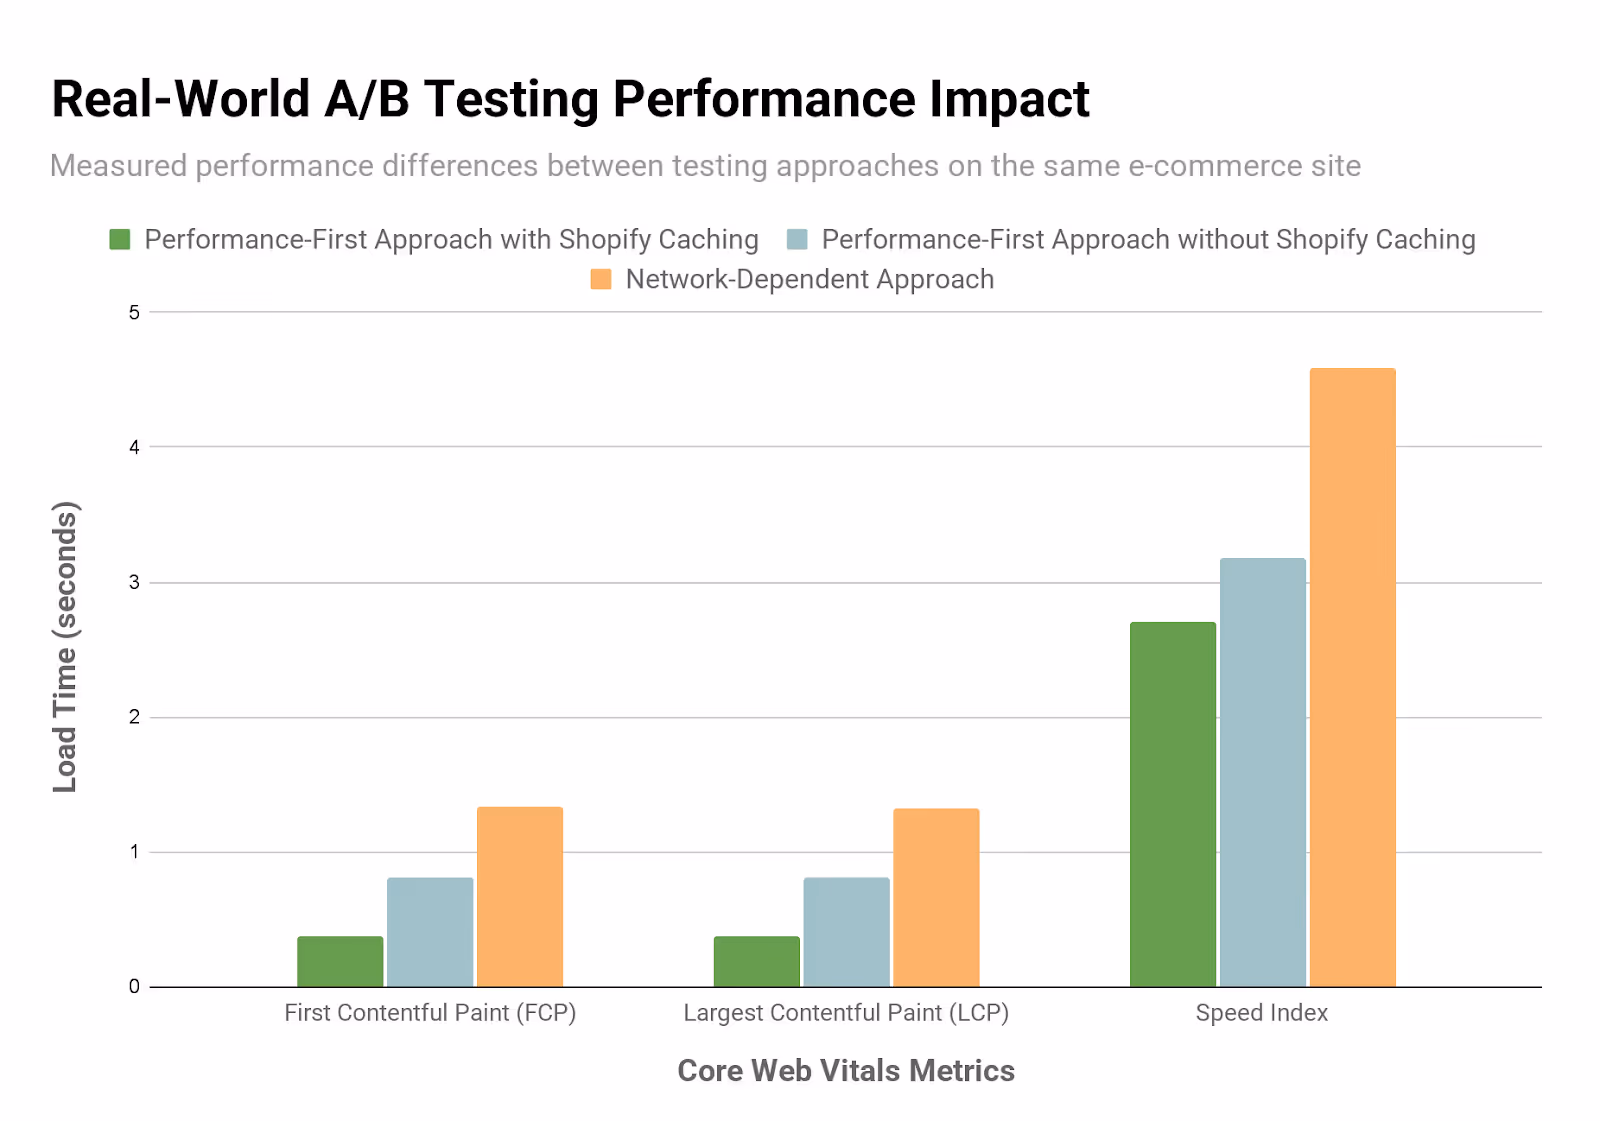
Key Performance Insights
- 3.6x faster first content display: Performance-first architecture with caching shows content in 0.37s vs 1.34s for a network-dependent approach
- 3.5x faster main content loading: Critical above-the-fold content loads in 0.38s vs 1.32s
- Native caching matters: Even within the same platform, caching created 2.2x performance differences
- Network dependency is the bottleneck: Tools requiring server requests for test determination consistently showed slower performance
The technical reality creates a performance cascade. Traditional testing tools follow a problematic sequence: visitor arrives → network request to testing server → wait for server response → determine variation → apply changes → display content to user. Each step compounds latency, particularly on mobile devices where network conditions are less reliable.

The Network Bottleneck Explained
The critical difference is the network round-trip time. Network-dependent tools must wait for a server response before determining which variation to show visitors. This creates a 400-500ms delay that compounds with geographic distance, network conditions, and server load—turning into 1-2+ second delays in real-world conditions. Performance-first tools do not need to wait at all roundtrips before presenting the test variant.
Additionally, anti-flicker techniques, used to prevent content from flashing between variations and offset network dependencies, can add 2-5 seconds to First Contentful Paint metrics impacting customer experience.
Why Poor Testing Performance Leads to Bad Business Decisions
Poor tool performance cascades into poor business outcomes. The combination of performance degradation from testing tools and unreliable results creates a double penalty: slower sites that appear to perform better in contaminated test environments.
Case studies show 30%+ performance improvements when problematic A/B testing tools are disabled, with corresponding conversion rate increases that exceed the optimization gains from testing programs.
What Performance-First Testing Looks Like
The Architecture Problem: Built-In vs. Layered-On Solutions
The research shows that optimization tactics can't fix fundamental architectural incompatibilities. The key differentiator isn't whether a tool is "client-side" or "server-side"—most tools use both approaches—but rather how quickly they can get visitors into test experiences without network delays.
Performance-first testing tools share common characteristics:
- Minimal network dependency: Test determination happens without waiting for server responses
- Intelligent script optimization: Code only executes when and where needed
- Native platform integration: Works with existing architecture rather than fighting it
- Imperceptible anti-flicker: Visitors never see blank screens or content flashing
Mobile Performance: Where the Differences Matter Most
The research consistently shows JavaScript execution runs 3-5x slower on mobile devices compared to desktop, amplifying the performance costs of testing tools. While desktop users might experience 200-500ms delays, mobile users frequently face 1-3 second degradation from network-dependent tools.
Memory constraints mean third-party scripts compete more aggressively with application resources, potentially causing crashes or severe performance degradation. The flicker effect that might be barely perceptible on desktop becomes glaringly obvious on mobile devices.
Peak Traffic: When Performance Problems Get Exposed
JavaScript execution queuing during peak loads can extend script processing times from hundreds of milliseconds to several seconds. Sites that perform acceptably under normal loads may become unusable during peak traffic—precisely when revenue opportunities are greatest.
The Brand and Agency Imperative
For Brands: The Multi-Million-Dollar Testing Risk
Flawed tests lead to flawed decisions. When your A/B testing tool degrades site performance, it doesn't just slow down your pages—it contaminates your results. Performance issues create false positives and negatives that can lead brands to implement changes based on skewed data, potentially resulting in multi-million-dollar strategic mistakes.
The math is sobering, even for smaller businesses. Consider a growing e-commerce brand generating $500K in monthly revenue. A false-positive A/B test showing a 5% increase in conversion rate leads to implementing a variation that actually performs 3% worse than the original due to performance degradation. The financial impact cascades:
Direct Revenue Impact:
- Month 1-12: 3% revenue loss = $180,000 annually
- Years 2-3: Compounded with missed growth opportunities = $400,000+ total
Hidden Costs:
- SEO impact: Declining Core Web Vitals reduce organic traffic by 8% = $96,000 annual opportunity cost
- Paid advertising: Poor landing page experience increases CAC by 12% = $144,000 in efficiency losses
- Customer experience: Reduced repeat purchase rates cost an additional $120,000 annually
Total 3-year impact: Over $1.2M in losses from what appeared to be a successful 5% improvement in testing.
The performance-first alternative: That same brand, using reliable testing that maintains site speed, implements a genuine 5% improvement that compounds over time, generating $600,000+ in incremental revenue over three years while avoiding the hidden costs of performance degradation.
The stakes have never been higher. When acquisition costs are high and margins are tight, the difference between accurate and inaccurate A/B testing results can determine which brands remain profitable and which ones struggle to survive in an increasingly competitive market.
Why Performance-First Testing Matters for Agencies
For agencies, performance-first testing creates client retention through measurable, uncompromised results. Agencies' incentives align with improving their clients' performance, and performance-first testing increases the likelihood of successful and accurate tests—leading to stronger client relationships.
The industry recognition of performance-first principles is growing rapidly, with market validation through widespread agency adoption demonstrating that experts are gaining appreciation for performance-first applications as the number of installed apps on their clients' sites increases.
The Solution: What to Look for in Performance-First Testing
Based on the research presented, organizations should evaluate A/B testing tools using these performance-first criteria:
Network Request Optimization
Look for tools that minimize server dependencies for test determination. The fastest tools resolve test variations without waiting for network responses, eliminating the primary bottleneck that affects visitor experience.
Anti-Flicker Implementation
Evaluate how tools handle content display during test loading. Performance-first solutions make anti-flicker effects imperceptible, while traditional tools may leave visitors staring at blank screens waiting for server responses.
Platform Integration Approach
Choose tools that work with your platform's native architecture rather than layering modifications on top. This reduces conflicts, improves reliability, and typically delivers better performance. Real-world testing shows that platform-native approaches can achieve 3.6x faster first content display compared to network-dependent methods. Even caching strategies matter—testing approaches that leverage platform-optimized caching show significantly better Time to First Byte performance.
Explore options tuned to work with your platform and built with a performance first integration approach:
- If you are using Webflow to build your own site from the ground up, checkout Intellimize.
- If you are on Shopify, look at Shopify-native tools like Shoplift.
Intelligent Script Execution
Look for solutions that optimize JavaScript execution based on visitor history, test placement, and current site conditions rather than running the same heavy processes for every visitor.
Peak Traffic Performance
Ensure your testing tool performs reliably during traffic spikes. Tools that depend heavily on external server responses may fail precisely when you need them most.
Measuring Your Current Testing Tool's Impact
Performance Audit Methodology
Evaluate your current testing tool's performance impact using these research-backed methodologies:
How to Evaluate A/B Testing Tool Performance

Key Metrics To Track

Testing Best Practices
Always test with "cold cache" conditions to simulate first-time visitor experience. Run multiple test iterations and use median values rather than averages to account for network variability. Consider testing from different geographic locations if you serve a global audience.
What to Look For
Minimal performance impact: Tools that add less than 100ms to core metrics
- Consistent performance: Similar results across different devices and conditions
- No visual flickering: Smooth content loading without flashing or blank screens
- Scalable architecture: Performance that doesn't degrade significantly under load
Business Impact Assessment
Consider the quantified business costs beyond just tool subscription fees:
- Lost conversions from performance degradation
- Unreliable test data leading to poor optimization decisions
- Development time spent troubleshooting tool conflicts
- Customer experience degradation during peak revenue periods
Making the Switch
The performance-first testing revolution is here, backed by comprehensive research and real-world evidence. Organizations should evaluate testing tools based on quantified performance impact rather than just functionality lists.
The question isn't whether you can afford to prioritize performance—it's whether you can afford not to.
Key Takeaways
Performance and testing aren't opposing forces—they should work together to improve your business outcomes. The evidence shows that:
- Testing tools can significantly impact site performance, with some adding 1-3 seconds to mobile load times
- Performance degradation from testing tools often exceeds the conversion gains from optimization
- Architecture-first approaches eliminate the fundamental bottlenecks that plague traditional testing tools
- Peak traffic scenarios expose critical vulnerabilities in network-dependent testing solutions
The future belongs to performance-first testing that enhances rather than compromises site speed. As the research demonstrates, this isn't just about faster loading—it's about more reliable results, better customer experiences, and sustainable optimization that scales with growth.
Frequently Asked Questions (FAQ)
General A/B Testing & Performance
Q: What is the difference between A/B testing and split testing? A: A/B testing and split testing are essentially the same thing. Both terms refer to comparing two versions of a webpage or element to determine which performs better for conversion rate optimization. The terms are used interchangeably in ecommerce optimization.
Q: How does A/B testing impact site speed? A: Traditional A/B testing tools can add 100-1500ms to page load times by requiring network requests to determine test variations. Performance-first testing tools minimize this impact by making decisions locally without server dependencies.
Q: What is a good conversion rate for ecommerce? A: Average ecommerce conversion rates typically range from 1-3%, but this varies significantly by industry. B2B ecommerce often sees higher rates (2-5%), while consumer electronics might see lower rates (0.5-2%). Focus on improving your baseline rather than comparing to industry averages.
Q: How can I increase my ecommerce conversion rate? A: Increase conversion rates through systematic A/B testing of key elements: product pages, checkout process, navigation, and landing page optimization. Ensure your testing tool doesn't slow down your site, as performance issues can negate optimization gains.
Shopify-Specific Questions
Q: What are the best A/B testing apps for Shopify? A: Look for Shopify A/B testing apps that integrate natively with the platform rather than layering additional code. Shoplift is designed specifically for Shopify performance optimization, while avoiding the speed penalties of traditional testing tools.
Q: How do I test my Shopify checkout process? A: Shopify checkout testing requires tools that work with Shopify's checkout architecture. Use Shopify Plus features or native apps that don't require external scripts that could slow down the critical checkout flow.
Q: Can A/B testing help with cart abandonment? A: Yes, A/B testing can significantly reduce cart abandonment by optimizing checkout flows, payment options, and trust signals. However, ensure your testing tool doesn't add delays that could increase abandonment rates.
Q: How do I optimize my Shopify product pages? A: Shopify product page optimization should focus on image loading speed, clear CTAs, social proof, and mobile experience. Use A/B testing to validate changes, but choose tools that maintain fast page speeds essential for mobile commerce.
Technical Performance Questions
Q: What are Core Web Vitals and why do they matter? A: Core Web Vitals are Google's key metrics for measuring user experience: First Contentful Paint (FCP), Largest Contentful Paint (LCP), and Total Blocking Time (TBT). These directly impact SEO rankings and conversion rates.
Q: How do I measure my website's bounce rate? A: Average bounce rates for ecommerce sites typically range from 40-60%. High bounce rates often indicate slow loading times or poor user experience. Use Google Analytics to track bounce rates and correlate with page speed improvements.
Q: What causes website performance issues? A: Common website performance issues include heavy third-party scripts, unoptimized images, slow A/B testing tools, excessive plugins, and poor hosting. Performance-first testing eliminates testing-related slowdowns.
Q: How do I improve my site's First Contentful Paint? A: Improve First Contentful Paint by minimizing render-blocking resources, optimizing critical CSS, and choosing A/B testing tools that don't delay initial content display. Target FCP under 1.8 seconds for optimal performance.
Business Impact Questions
Q: How much can slow page speed cost my business? A: Studies show that 100ms delays can reduce sales by 1%. For a business doing $20M annually, this could mean $200,000+ in lost revenue. Performance-first testing ensures optimization efforts don't create these costly delays.
Q: Should I prioritize testing or site speed? A: You shouldn't have to choose. Performance-first testing allows you to optimize conversion rates while maintaining fast site speed. Traditional tools that force this choice often cost more in lost conversions than they provide in optimization gains.
Q: How do I calculate ROI on conversion rate optimization? A: Calculate CRO ROI by comparing increased revenue from improved conversion rates against tool costs and implementation time. Factor in potential revenue lost to performance degradation when evaluating testing tools.
CRO ROI = (Additional Annual Revenue - Total CRO Costs) / Total CRO Costs × 100
- Additional Annual Revenue = (Conversion Rate Lift %) × Current Annual Revenue
- Total CRO Costs = Tool costs + Implementation + Performance impact costs
Example: A 0.3% conversion rate improvement on $3M annual revenue = $270,000 gain. With $12,000 in tool costs and $13,500 performance loss from slow testing tools:
- CRO ROI = ($270,000 - $12,000 - $13,500) / $25,500 × 100 = 958%
- Factor in potential revenue lost to performance degradation when evaluating testing tools—performance-first solutions protect your optimization ROI.
Q: What's the difference between CRO and UX optimization? A: Conversion rate optimization (CRO) focuses specifically on increasing conversions, while UX optimization improves overall user experience. The best approach combines both, using A/B testing to validate UX improvements' impact on conversions.
Industry & Platform Questions
Q: How does B2B ecommerce testing differ from B2C? A: B2B ecommerce testing often focuses on longer sales cycles, multiple decision makers, and complex pricing structures. B2B ecommerce optimization may prioritize lead generation and account-based features over immediate purchases.
Q: What are the best practices for mobile commerce optimization? A: Mobile commerce optimization requires fast loading times (under 3 seconds), touch-friendly design, and streamlined checkout. Mobile users are especially sensitive to performance issues, making performance-first testing crucial.
Q: How do I optimize for different marketing channels? A: Online marketing channels like PPC, social media, and email require different landing page optimization strategies. Use A/B testing to create channel-specific experiences while maintaining consistent site performance.
Q: What personalization tools work best with performance-first testing? A: Look for personalization tools that integrate natively with your platform and don't require additional network requests. Website personalization should enhance rather than hinder site performance.
Advanced Testing Questions
Q: What's the difference between A/B testing and multivariate testing? A: A/B testing compares two versions of a single element, while multivariate testing tests multiple elements simultaneously. Multivariate testing requires more complex tools and larger traffic volumes but provides insights into element interactions.
Q: How do I ensure statistical significance in my tests? A: Statistical significance testing requires adequate sample sizes and test duration. Most tests need at least 1,000 conversions per variation and should run for complete business cycles (typically 1-2 weeks minimum).
Q: What are common A/B testing mistakes to avoid? A: Common A/B testing mistakes include testing too many elements at once, ending tests too early, not accounting for seasonality, and using tools that slow down your site enough to skew results.
Q: How do I test during peak traffic periods? A: Peak traffic testing requires tools that maintain performance under load. Many traditional A/B testing tools fail during high-traffic periods when you need them most, making performance-first solutions essential for Black Friday and holiday optimization.
Ready to implement performance-first A/B testing for your Shopify store? Learn more about how Shoplift can help you optimize conversions without compromising site speed.
References
¹ ConversionXL & OrangeValley Research Study (2016). "How 8 Different A/B Testing Tools Affect Site Speed." Comprehensive comparative analysis of A/B testing tool performance impact. Available at: https://cxl.com/blog/testing-tools-site-speed/
² Google Core Web Vitals Documentation. "Optimize Core Web Vitals for business decision makers." Official Google documentation acknowledging A/B testing impact on Core Web Vitals metrics. Available at: https://web.dev/articles/optimize-cwv-business
³ Hofman, E. (2024). "Core Web Vitals A/B testing best practices." Independent performance consultant analysis of A/B testing technical characteristics and optimization strategies. Available at: https://www.erwinhofman.com/blog/core-web-vitals-ab-testing-best-practices
⁴ Catchpoint Performance Analysis. "A/B Testing and Web Performance." Technical analysis showing JavaScript A/B testing tools contributing average 600ms to page response times. Available at: https://www.catchpoint.com/blog/ab-performance-testing
⁵ RUMvision Case Study (2023). "A/B Testing and Core Web Vitals: instant 30% FCP boost in under 3 minutes." Real User Monitoring study documenting 30%+ First Contentful Paint improvement when client-side A/B testing was disabled. Available at: https://www.rumvision.com/use-cases/a-b-testing-and-core-web-vitals-instant-30-fcp-boost-in-under-3-minutes/
⁶ Underwood, C. (2021). "Cumulative Layout Shift (CLS) and A/B Testing." Academic analysis of A/B testing reliability and Core Web Vitals impact, documenting false positive rates in testing implementations. Available at: https://cunderwood.dev/2021/04/11/cumulative-layout-shift-cls-and-a-b-testing/
⁷ Portent Digital Marketing Agency (2024). "Site Speed is (Still) Impacting Your Conversion Rate." Comprehensive analysis of over 100 million pageviews from B2B and B2C websites showing e-commerce sites that load in 1 second have conversion rates 2.5x higher than sites loading in 5 seconds. Available at: https://portent.com/blog/analytics/research-site-speed-hurting-everyones-revenue.htm
⁸ Portent B2B Conversion Rate Study (2024). Analysis of 27,000+ landing pages demonstrating that B2B sites loading in 1 second achieve conversion rates 3x higher than sites loading in 5 seconds, and 5x higher than sites loading in 10 seconds. Referenced in: HubSpot Marketing Research (2023). Available at: https://blog.hubspot.com/marketing/page-load-time-conversion-rates
9 Website Loading Times Report (2023). Analysis of over 4 billion web visits showing mobile pages load 70.9% slower than desktop, with average load times of 8.6 seconds on mobile vs 2.5 seconds on desktop. Referenced in: HubSpot Page Load Time Statistics (2023). Available at: https://blog.hubspot.com/marketing/page-load-time-conversion-rates
10 HTTP Archive / Chrome UX Report (2023). "A faster web in 2024." Real user monitoring data showing 42.5% of websites passing Core Web Vitals assessment as of September 2023, representing steady improvement from 40.1% at start of year. Available at: https://rviscomi.dev/2023/11/a-faster-web-in-2024/
11 Amazon Performance Research (2006-2015). Widely cited industry study showing 100ms delay equals 1% drop in revenue. Referenced across multiple industry publications and case studies. Note: Original Amazon study details are proprietary, but findings have been consistently referenced in academic and industry literature. Referenced in: HubSpot (2023), Conductor (2025), and multiple performance case studies.
12 Walmart Web Performance Study (2012). Internal presentation documenting real user monitoring results showing "100ms improvement = Up to 1% incremental revenue" and "Every 1s improvement = Up to 2% increase in CVR." Available at: https://www.slideshare.net/devonauerswald/walmart-pagespeedslide
13 Vodafone Core Web Vitals Case Study (2024). A/B testing study measuring impact of optimized Core Web Vitals, showing 31% LCP improvement leading to 15% improvement in lead-to-visit rate, 11% improvement in cart-to-visit rate, and 8% more sales. Referenced in: HubSpot Page Load Statistics (2023), Google's Core Web Vitals business impact documentation. Available at: https://web.dev/case-studies/vitals-business-impact
14 Kameleoon A/B Testing Analysis (2024). "How to avoid common data accuracy pitfalls in A/B testing." Industry research showing that "a statistically significant result can be wrong +26.4% of the time" and documenting false positive rates and testing reliability challenges. Available at: https://www.kameleoon.com/blog/data-accuracy-pitfalls-ab-testing
15 Kohavi, R., et al. (2024). "False Positives in A/B Tests." Proceedings of the 30th ACM SIGKDD Conference on Knowledge Discovery and Data Mining. Academic research documenting that "most experiments fail to improve key metrics, and success rates of only about 10-20% are most common" in large-scale software experimentation. Available at: https://dl.acm.org/doi/10.1145/3637528.3671631
Additional Reviewed Source: https://www.binaery.com/blogs/conversion/shoplift-vs-visually
Want to learn more about performance-first A/B testing? The research continues to evolve as more organizations recognize the critical importance of testing tools that enhance rather than compromise performance.
